
We measured 28 WordPress sites for speed: what keeps them fast
We tested all 28 PageCore demo sites with Lighthouse on phones and desktops. The results, what keeps them fast and what still slows some down.

We test what we make. On 8 November 2026 we ran Lighthouse, the test inside Google’s PageSpeed Insights, on the home page of every PageCore demo site: 28 complete WordPress sites, each built with WordPress’s own blocks and the PageCore FSE theme. Every page was tested three times on a simulated phone and three times on a desktop.
Here are the results, what keeps these sites fast, and what still slows some of them down. The same lessons apply to any WordPress site.
In short
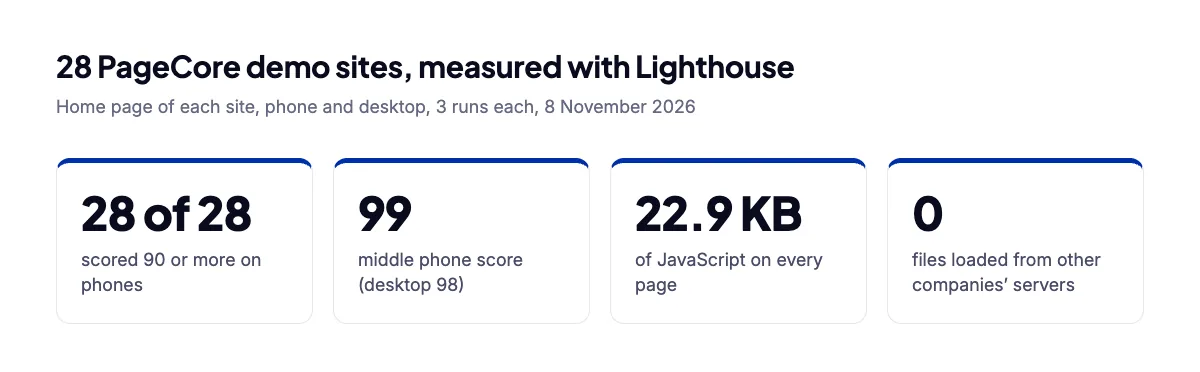
- On phones, all 28 sites scored between 95 and 99; the middle score was 99.
- On desktops, 27 of 28 scored 90 or more; the middle score was 98.
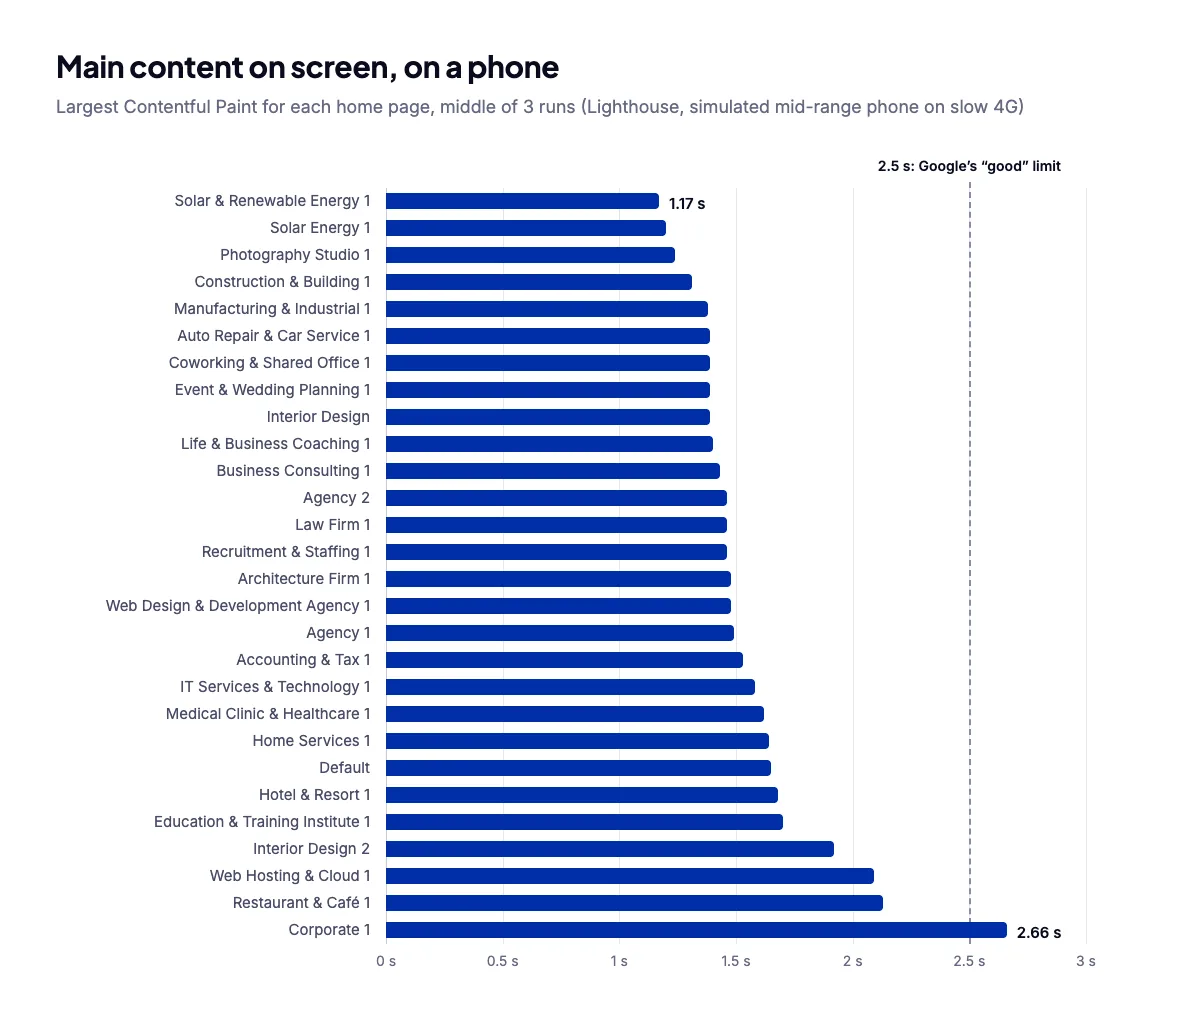
- The main content appeared in 1.47 seconds on a phone (middle value); 27 of 28 stayed within Google’s 2.5-second target.
- Every page loads the same 22.9 KB of JavaScript and nothing from other companies’ servers.
- The differences between the sites came from their pictures and number of files, not their code.
How we tested
- Tool: Lighthouse 12.8.2, the same test PageSpeed Insights runs.
- Phone: Lighthouse’s standard phone test, a simulated mid-range phone on a slow 4G connection.
- Desktop: Lighthouse’s standard desktop test.
- Pages: the home page of each live demo site.
- Runs: three of each, and we show the middle result, because single runs vary (more on that below).
These are lab tests: the same conditions for every site, which makes them easy to compare. Real visitors’ speed also depends on their phone and connection; Google collects that field data once a site has enough visitors.
The results
Every site, with its phone and desktop scores, the time until the main content appears on a phone and the size of the page on a phone, fastest first:
What keeps them fast
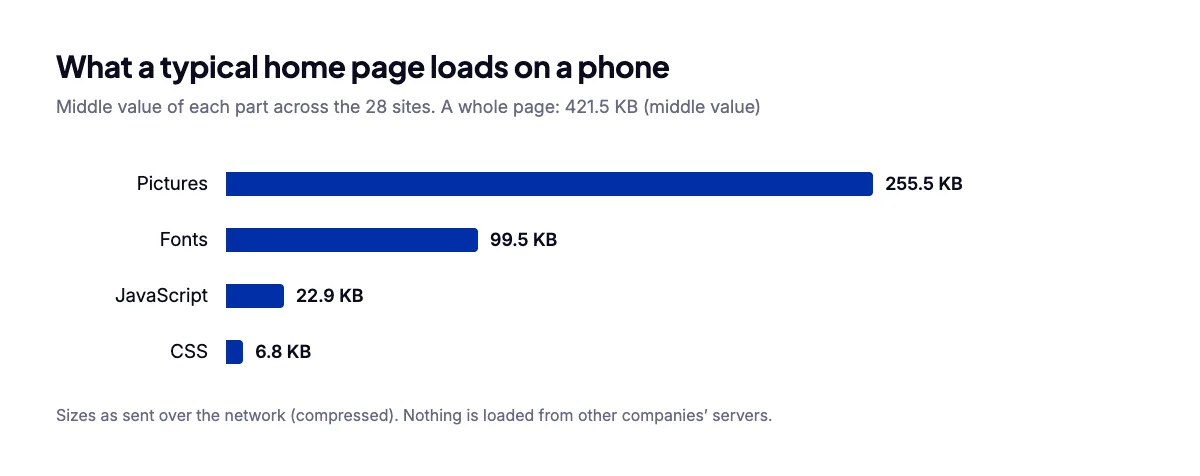
- Very little JavaScript. Every page loads the same 22.9 KB. The pages are made of WordPress’s own blocks, so there are no slider, animation or layout-tool scripts to download and run.
- Nothing from other servers. No outside fonts, trackers, chat widgets or embeds: 0 files from other companies on every page.
- Small styles. 6.8 KB of CSS per page, because WordPress loads only the styles of the blocks on the page.
- Modern pictures. WebP images in sizes that fit the screen, with pictures further down the page loading only when needed.
- A steady layout. Nothing jumps while loading: the largest layout shift we measured was 0.054, well under Google’s limit of 0.1.
What still slows some of them down
With the same light code on every page, the differences are small, and they come from the content. The seven fastest sites showed their main content in 1.30 seconds on average, the seven slowest in 1.98. The slower ones loaded a few more files (23 against 21) and heavier pictures (369 KB against 322 KB).
- Corporate 1 was the slowest on a phone: 2.66 seconds, just over Google’s 2.5-second target. It also loads the most files, 29.
- Fonts are the second-largest part of a page, from 24 KB to 209 KB depending on how many fonts and weights a style uses.
- Accessibility: 24 sites scored 100; 4 scored between 93 and 95, with small issues we can fix.
One test is not enough
Scores move between runs, especially on desktop, where pages load in well under a second and a small hiccup costs a lot of points. One desktop run of Web Hosting & Cloud 1 scored 61; the other two scored 97 and 98. If we had tested once, we would have reported a very different number.
So test your own site three times and look at the middle result, and watch the timings (when the main content appears, how much the page jumps) as well as the score.
What this means for your site
- Keep JavaScript small: every slider, animation library and extra plugin adds to it.
- Avoid scripts from other companies unless they earn their place.
- Make pictures the right size and save them as WebP; they are most of a page’s weight.
- Use two font families at most, and only the weights you need.
- Test three times, on the phone results first.
For the full list of causes and fixes, see why your website is slow. Every site above is a starter site you can import with PageCore and make your own.
Questions
Are these real-world speeds?
They are lab results: every site tested under the same conditions, which makes them fair to compare. Real visitors’ speed also depends on their phone, connection and location.
Will my site be as fast after I add my own content?
It depends mostly on your pictures and any plugins or outside scripts you add. Starting from a light site helps, and the advice above keeps it that way.
Why do desktop scores change more than phone scores?
Desktop pages load in well under a second, and Lighthouse scores desktop timings against stricter targets, so a small delay in one run moves the score more.
How can I test my own site?
Use PageSpeed Insights: enter your address, look at the phone results, and run it three times.
Sources

Keep reading

Development
Why your website is slow: the 8 usual causes and the fixes
The eight things that slow most websites down, how to spot each one, and the fixes that make the biggest difference.

Design
7 font pairings that make a website look expensive
Seven font pairings that make a website feel premium, from real designs: where each works, why it looks expensive, and how to use it well.

Design
Colour palettes for 10 industries, from real website designs
Ten website colour palettes, one per industry, from real designs: the four colours of each, why they work and the starter site that uses them.